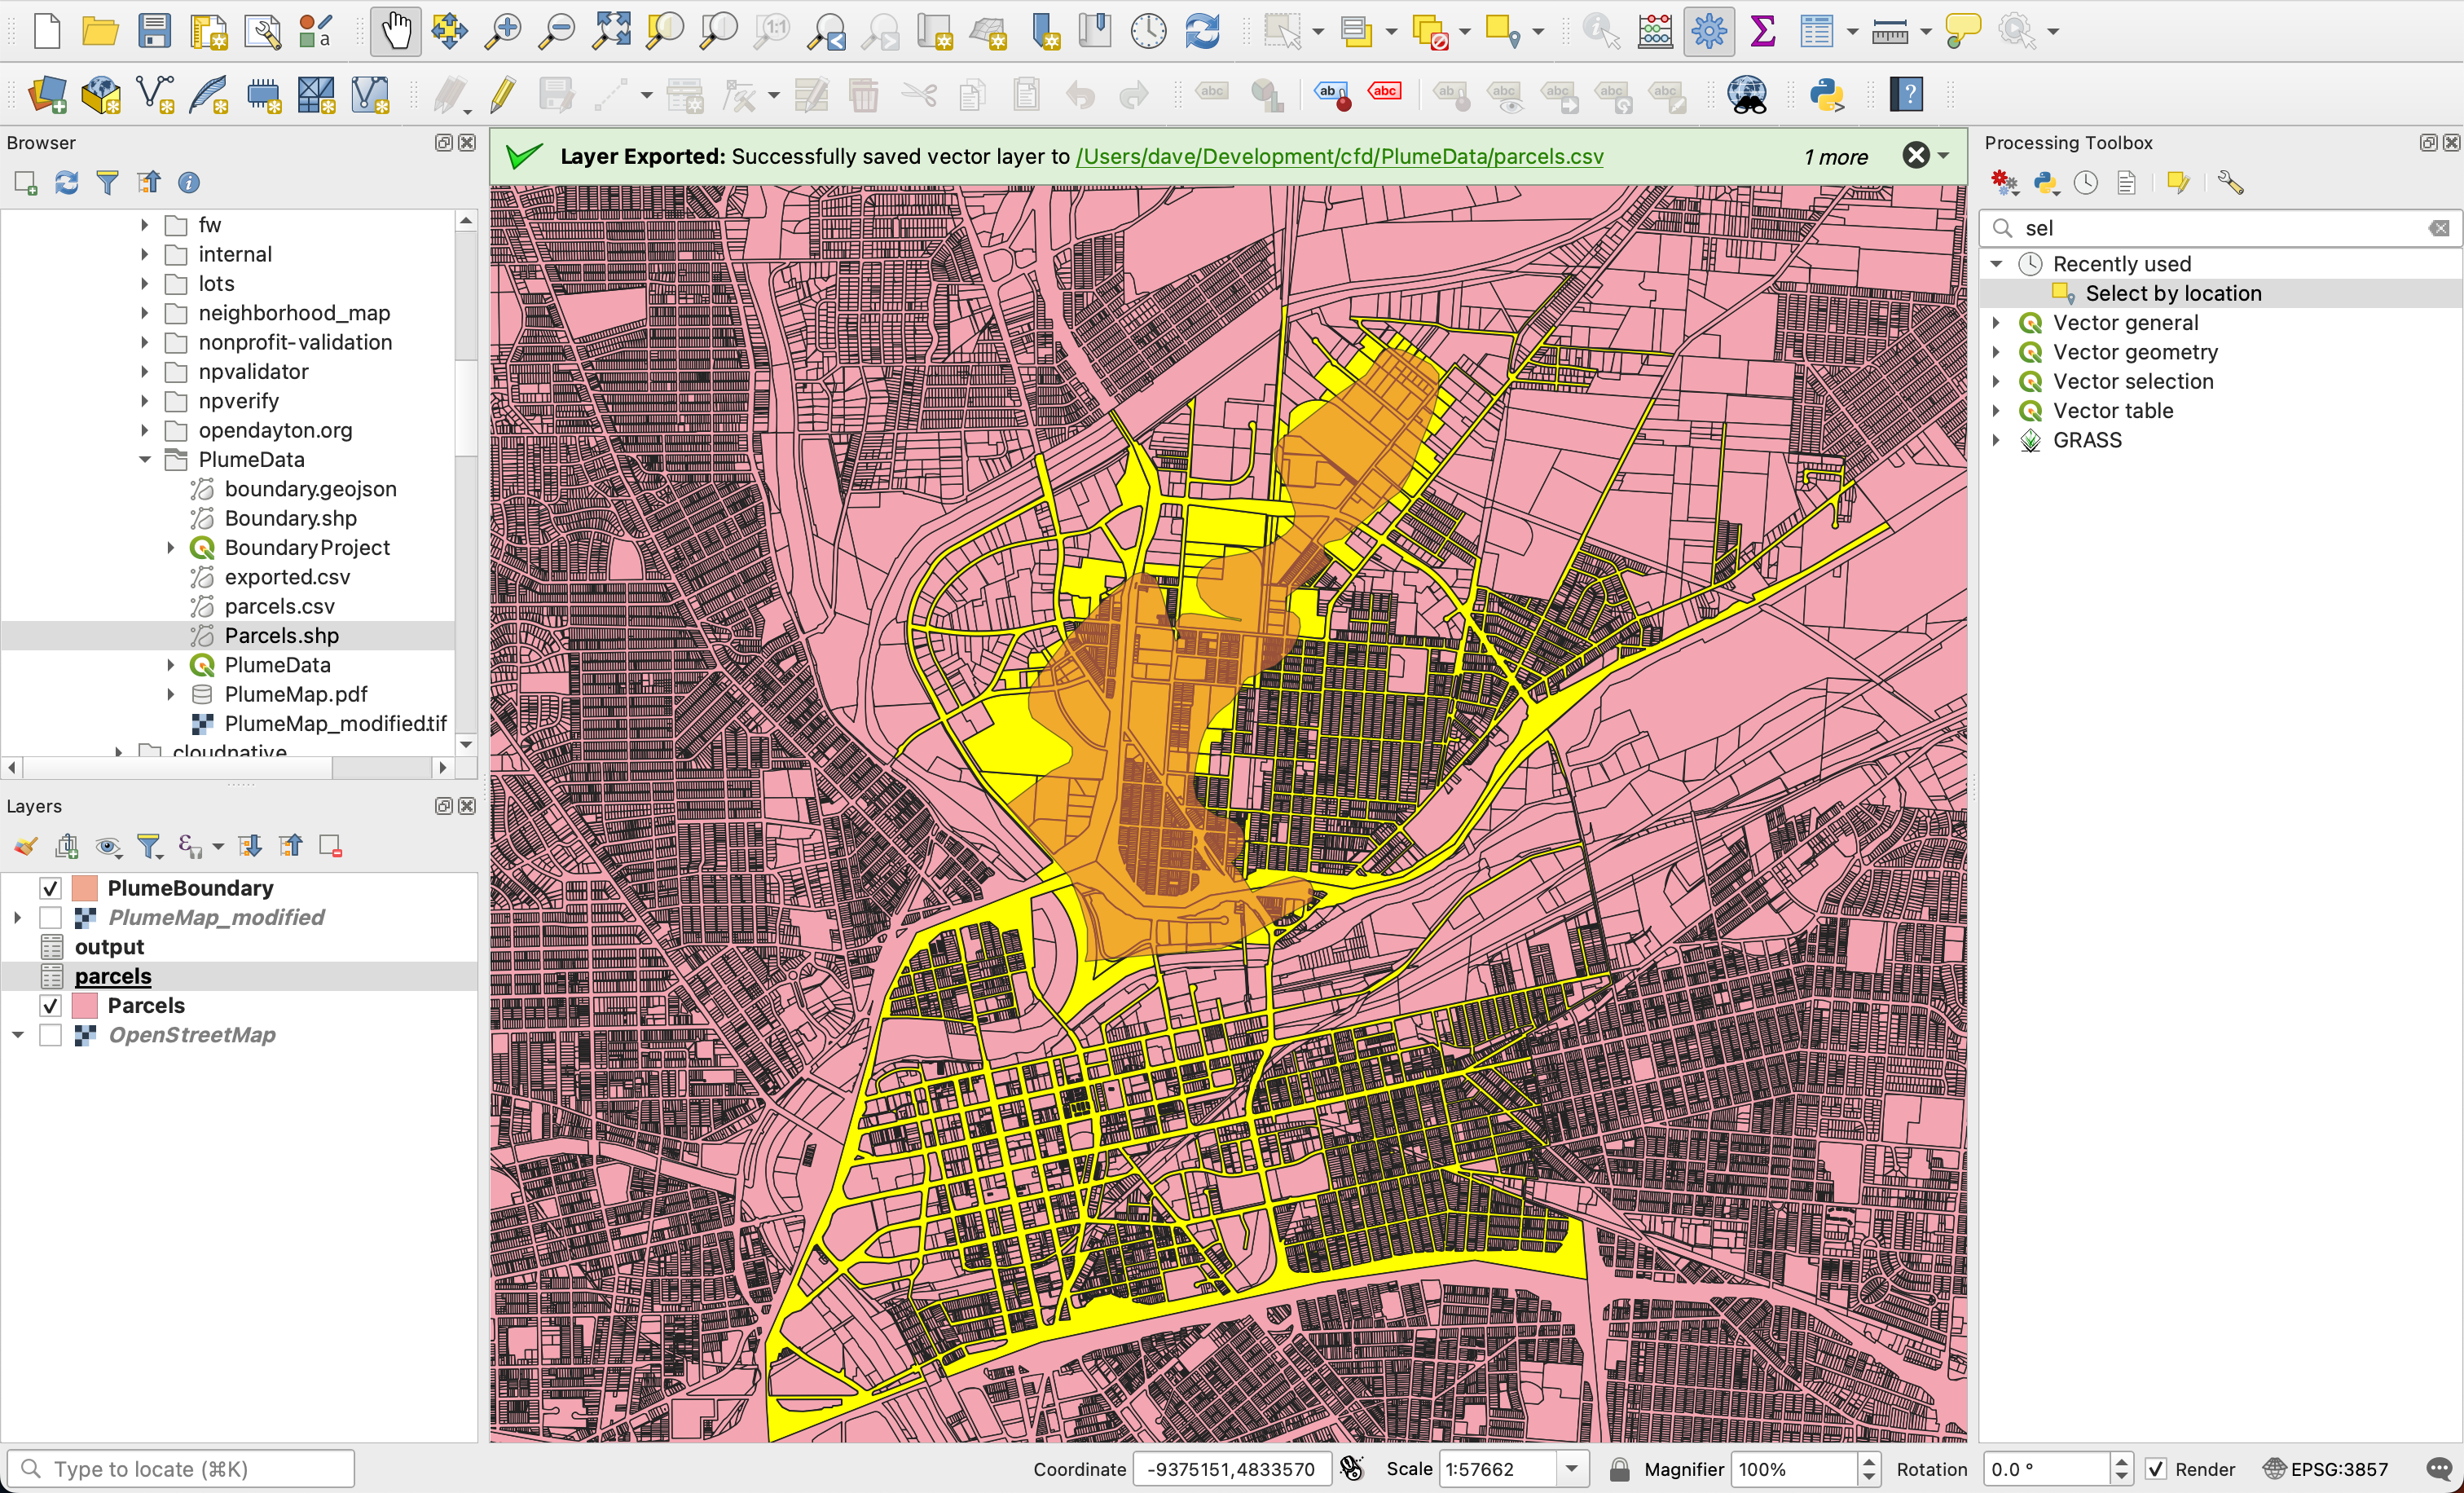
For our May meeting, we explored QGIS, an open source Geospatial Information System (GIS) tool. It is an amazingly powerful tool for exploring and manipulating geospatial data.
Last month, Janet and I got the following request:
We have a Superfund site in our neighborhood. Vapors from the contamination can seep into homes. Part of the remediation is to test homes over the plume for these vapors and, if present, install a vapor abatement system. Many of the homes have never been tested so our outreach plan is to go door to door to eligible homes with project literature. The Environmental Protection Agency provided us a map showing the eligible areas but they are unwilling to give us actual street addresses, which would be so much more helpful. It’s a very grainy PDF map at best … see MAP - TCE VAPOR INTRUSION AREA OF POTENTIAL CONCERN (epa.gov).
Any thoughts on whether a savvy GIS expert could use this to hone in on an actual boundary for selecting addresses?
Turns out, this is fairly straightforward to do in QGIS. We’re going to walkthrough the process of answering this request this evening.
What you need if you want to follow along:
Here’s the process that we followed:
- Create a new empty QGIS project.
- Add OpenStreetMap as a basemap. We will use this to help georeference the PDF map.
- Add the Parcel Shapefile as a layer. We are using the
Parcels.shp file from the downloaded zip file.
- Georeference the PDF file. This was time consuming and took a fair amount of trial and error. We used the built in Georeferencer tool to do this. Our approach was to align corners of buildings in the PDF to the same buildings in the OpenStreetMap layer. We mapped 8 or so points, and enabled and disabled them to try and see how well they lined up. Our goal was to have less than 10 pixels of error around the boundary. We checked our work by flashing the georeferenced image on and off to see how well it lined up with the OpenStreetMap layer.
- Once we had the PDF suitably lined up, we created a new shapefile layer and digitized the boundary of the plume. We used the
Add Polygon Feature tool to do this.
- Once we were satisfied with the boundary, we used the
Select by Location tool to select all of the parcels that intersected the plume boundary.
- We saved the selected features as a CSV file and shared it with the requester.

I was really impressed with how easy it was to do this in QGIS. I hadn’t used the tool before; it always seemed daunting, but this seemed like a perfect used case for it. I’m looking forward to exploring it more in the future and adding it to the group’s toolbox.
Dave

